

Calculator
Does Your Masterbatch Cost More Than You Think?
A First-Principles Look at Back Pressure, Cycle Time, and the Hidden Economics of Masterbatch Selection
When evaluating masterbatch suppliers, most procurement decisions reduce to a single number: price per kilogram. This is understandable, it is visible, comparable, and requires no further analysis. However, for process engineers who live inside the injection moulding cycle, the price-per-kg metric is incomplete. It ignores a variable that sits quietly in the machine HMI, logged every shot, rarely interrogated: back pressure.
The Physics
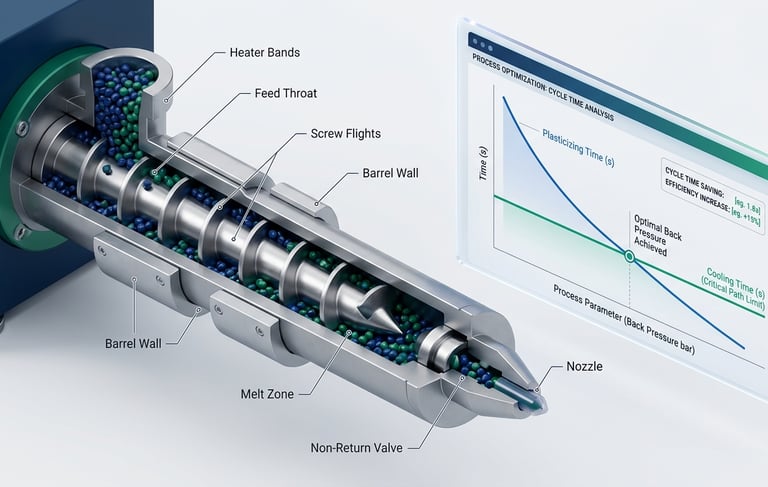
During the plasticising stage of injection moulding, the screw rotates and retracts to accumulate melt in front of the screw tip. Back pressure is the hydraulic resistance applied against this retraction, it forces the screw to work harder, generating additional shear in the metering zone. This shear is the primary mechanism by which masterbatch agglomerates are broken down and pigment is homogeneously distributed in the melt.
The relationship between back pressure and plasticising rate follows directly from the single-screw output equation (Tadmor & Gogos, Principles of Polymer Processing, Wiley, 2006, Ch. 6):
Q_net = Q_drag − Q_pressure
where Q_pressure is proportional to the applied back pressure ΔP. Higher back pressure reduces net throughput of the screw, extending plasticising time. In the cycle time equation:
t_cycle = t_injection + t_holding + max(t_plasticising, t_cooling)
when plasticising is on the critical path that is, when t_plasticising exceeds t_cooling, every additional second of plasticising time directly extends the cycle. This is machine time. Machine time has a rate. The arithmetic is straightforward.
The Practical Implication
A masterbatch with poor pigment dispersion, quantifiable via the Filter Pressure Value (FPV) test per EN 13900-5, forces the processor to compensate with elevated back pressure to achieve acceptable colour homogeneity. The machine does the dispersive work that the masterbatch supplier did not. This compensation is invisible in the price-per-kg comparison but fully visible in the cycle time log.
Conversely, a masterbatch with superior pre-dispersion (lower FPV) requires less back pressure to achieve the same or better colour uniformity. If plasticising is on the critical path, this translates directly into a shorter cycle, higher throughput, and lower cost per part potentially offsetting a higher MB unit price entirely.
The magnitude of this effect is machine and material specific. It cannot be calculated from assumed constants without introducing error. It must be measured.
What is This Calculator About
The tool quantifies the cycle time and annual cost saving from back pressure reduction, using no assumed constants. Instead, it requires two empirical measurements from the actual production machine:
Plasticising time at the current (higher) back pressure setting
Plasticising time at a lower back pressure setting
From these two points, the calculator derives the machine-specific pressure sensitivity coefficient, interpolates plasticising time at any target back pressure within the measured range, applies the critical path logic, and outputs the annual saving in local currency.
The interpolation is linear, consistent with the linear pressure-flow relationship in the Tadmor & Gogos model. The calculator explicitly warns when the target pressure falls outside the calibrated range, where extrapolation accuracy degrades.
Important: the calculator also checks whether plasticising is actually on the critical path. If cooling time exceeds plasticising time, reducing back pressure delivers no cycle time benefit and the value argument must shift to other measurable drivers: reduced mould deposit frequency, lower scrap rate, or let-down ratio optimisation. The tool flags this condition explicitly so the analysis remains honest.
How to Use It
You will need five minutes at the customer's machine with access to the HMI cycle monitor. Record plasticising time at two different back pressure settings — keeping screw speed constant between measurements. Everything else follows from the calculation.
The checklist inside the tool lists all parameters required for a complete analysis, including the additional value drivers beyond cycle time.
References:
Tadmor & Gogos, Principles of Polymer Processing, Wiley 2006
ARBURG Practical Guide to Injection Moulding, 2nd Ed. (Goodship)
EN 13900-5 Filter Pressure Value test method
Reach out anytime for chemical engineering or chemical application tips or discussion
Contact US
contact@mdm-technology.com
taramkt@gmail.com
+62811883915
+62818159065
© 2026. MDM Technology All rights reserved.