

Why "Our Masterbatch Quality Is Better" Means Nothing
And What to Say Instead
PUBLICINJECTION MOLDING
Arif Sarwono
5 min read
Every masterbatch supplier says the same thing.
"Our quality is better than the competitor."
The customer nods politely, asks for a price, and buys the cheaper one anyway.
This happens not because the claim is wrong, it may be entirely true, but because the claim is not connected to anything the customer cares about. Quality without a number is just opinion. And in a purchasing conversation, opinion loses to price every time.
This article explains how to turn masterbatch quality into a number, specifically, a Rupiah figure that appears on the customer's P&L.
The Quality Metric Most Suppliers Ignore
There is a standardized test for masterbatch dispersion quality called the Filter Pressure Value test, specified under EN 13900-5. It measures how quickly agglomerates in the masterbatch block a standardized screen pack under controlled melt flow conditions.
The result is expressed in bar/g, pressure rise per gram of pigment passing through the screen.
Lower FPV = fewer agglomerates = better pre-dispersed masterbatch.
Most masterbatch suppliers do not publish this number. Some do not test it at all. This is not accidental, a supplier running cheap, poorly-dispersed masterbatch has no incentive to give their customer a tool that reveals the quality gap.
But if you test your own masterbatch and know your FPV, you have a measurable quality credential. The question is: what does that quality credential translate to, economically, for the injection moulder?
The Back Pressure Connection
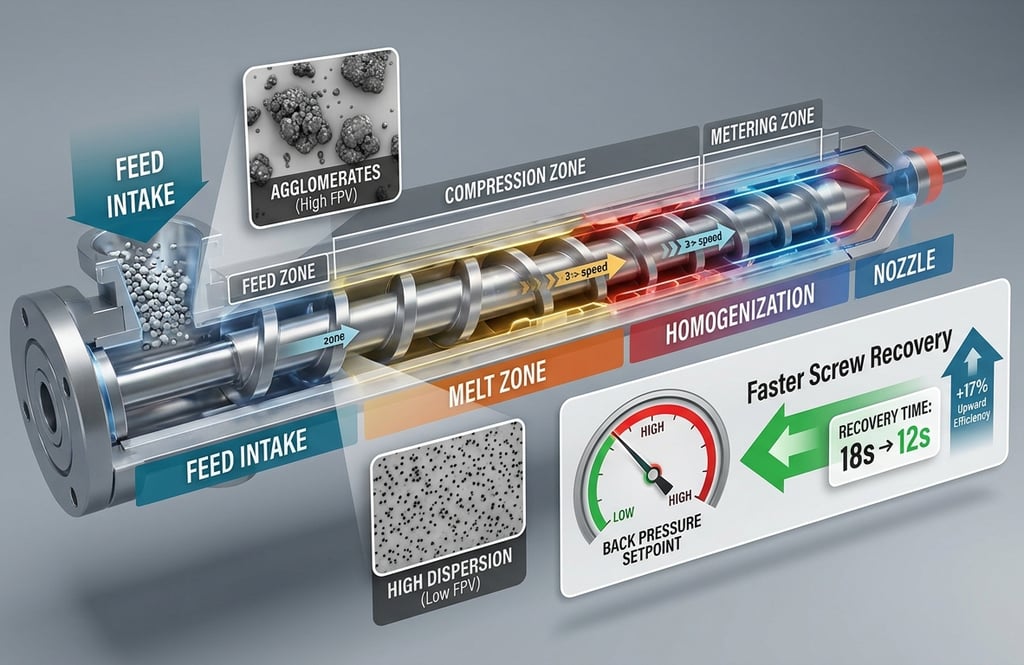
During injection moulding, after each shot is injected, the screw rotates backward to prepare the next shot. This is called the screw recovery or plasticizing phase.
As the screw rotates, it melts and mixes the polymer with the masterbatch. If the masterbatch contains many agglomerates, reflected by a high FPV, the screw must work harder to break them apart. The operator compensates by increasing back pressure: the hydraulic resistance applied against the screw's rearward movement.
More back pressure generates more shear in the metering zone, which breaks agglomerates but at a cost. It slows the screw down. Screw recovery takes longer.
The physics of this is established in Tadmor & Gogos (Principles of Polymer Processing, Wiley 2006, Chapter 6). The screw's net output rate decreases linearly with back pressure. More back pressure = longer screw recovery time.
When Screw Recovery Time Matters: The Critical Path
Here is the crucial concept that determines whether any of this translates into money.
The injection moulding cycle has several phases running in sequence:
t_cycle = t_mech + t_injection_holding + max(t_recovery, t_cooling)
The max() function is the key. Screw recovery and cooling happen simultaneously, the screw is already preparing the next shot while the current part is cooling in the mould.
If screw recovery time is longer than cooling time, the machine is waiting for the screw to finish before it can open the mould. Every second of unnecessary screw recovery time is a second added to cycle time.
If screw recovery time is shorter than cooling time, the screw finishes early and waits. Reducing back pressure in this scenario saves nothing, the cycle is bottlenecked by cooling, not the screw.
This means the first question to ask at any customer visit is: is screw recovery on the critical path? A quick look at the HMI tells you. If screw recovery time exceeds cooling time, you have a viable cycle time argument. If not, move to the LDR argument instead.
Two Economic Arguments, Not One
Better masterbatch quality translates into money through two separate routes:
Argument 1 --> LDR Saving
Better dispersion means higher tinting strength, the same colour is achieved at a lower let-down ratio. Less masterbatch consumed per kilogram of resin. This is a direct material cost saving, calculable with nothing more than the LDR difference and annual resin volume.
This argument works regardless of whether screw recovery is on the critical path. It is often the easier argument to make, the purchasing manager understands it immediately.
Argument 2 --> Cycle Time Saving
If screw recovery is the bottleneck, lower back pressure from better MB quality directly reduces cycle time. The annual monetary value:
Cycle saving = (Δt_cycle / t_cycle) × machine_rate × operation_hours × n_machines
For a machine running at IDR 500,000/hour, 6,000 hours per year, even a 2-second cycle time reduction is worth IDR 30 million per machine per year. On a factory of five machines, that is IDR 150 million often far exceeding the price premium of the better masterbatch.
The Honest Limitation
One important technical clarification. FPV explains why back pressure differs between masterbatches, it is the scientific credential proving your quality claim. But FPV alone cannot predict the exact back pressure reduction on a specific customer machine. The relationship between FPV and required back pressure also depends on machine screw geometry, base resin viscosity, and the pigment's specific crystal form and surface treatment.
The monetary calculation must be based on actual trial measurements, not predicted from FPV alone. Run your masterbatch on the customer's machine, find the lowest back pressure at which colour quality is acceptable, measure screw recovery time at that setting, and compare to the incumbent's current numbers.
FPV is the quality credential. The trial measurement is the proof.
From Qualitative Claim to Quantifiable Business Case
The complete conversation with a customer should look like this:
Quality credential: "Our masterbatch has FPV of 5 bar/g. The industry average for commodity masterbatch is typically 15–25 bar/g. This difference reflects how well the pigment is dispersed before it enters your machine."
Trial result: "In the trial on your machine, we achieved equivalent colour at 8 bar back pressure versus 15 bar for your current masterbatch. Screw recovery time dropped from 12 seconds to 9.5 seconds."
Critical path check: "Your cooling time is 8 seconds. At 12 seconds screw recovery, you were waiting for the screw on every cycle. At 9.5 seconds, you still are, but 2.5 seconds less."
Monetary output: "That 2.5-second cycle saving is worth IDR X million per year on this machine, at your machine rate. Your LDR reduces from 5% to 4.5%, saving IDR Y million in material. Total benefit: IDR X+Y million. Our price premium is IDR Z million. Net saving: IDR X+Y−Z million."
Verdict: A number. Not an opinion.
Conclusion
The masterbatch industry has sold on relationships, samples, and vague quality claims. The tools to do it differently, EN 13900-5 testing, established process physics, straightforward arithmetic have existed for years. What was missing was a calculator that assembled these into a defensible business case in a format a purchasing manager could read and act on.
Better masterbatch quality is real. It is measurable. And it is worth Rupiah. The only remaining question is whether you can show the number or whether you will keep asking the customer to take your word for it.
The FPV & Back Pressure Monetary Saving Calculator, available at our online store, automates this entire business case calculation from trial data input to net annual saving verdict and auto-generated narrative for customer presentation.
Have a specific challenge in your production process?
All technical consultations and inquiries are treated as strictly confidential. Production details, formulation data, and business information you share are used only to serve your specific needs — never disclosed to third parties or supply chain partners without your consent. Reach out to Arif Sarwono at contact@mdm-technology.com
Reach out anytime for chemical engineering or chemical application tips or discussion
Contact US
contact@mdm-technology.com
taramkt@gmail.com
+62811883915
+62818159065
© 2026. MDM Technology All rights reserved.