

Bond Strength in Flexible Packaging: Three Test Variables That Every Quality Manager Should Know
How three permitted variables inside your test method can move your laminate bond strength reading without changing a single gram of adhesive
FLEXIBLE PACKAGINGPUBLIC
Arif Sarwono
10 min read
Three Variables That Change Bond Strength Measurement In Flexible Packaging
There is a number that travels through the flexible packaging supply chain with the authority of an objective fact. It appears on quality certificates, incoming inspection reports, supplier audits, and customer complaint letters. Converters use it to prove their laminate is good. Brand owners use it to reject laminates that fail their specification. Adhesive suppliers use it to benchmark their products against competitors.
That number is bond strength, typically reported in N/15mm or N/25mm from a T-peel test conducted according to ASTM D1876 or equivalent standard.
It is a system output that depends on at least three variables that testing practice and in some cases the standard itself, permits to vary. When those variables differ between stakeholders' laboratories, the same laminate roll can produce genuinely different numbers from both sides. Both compliant. Both defensible. Neither directly comparable.
What ASTM D1876 Specifies and Where Variation Enters In Practice
ASTM D1876, the Standard Test Method for Peel Resistance of Adhesives (T-Peel Test), is the most widely used standard for measuring dry lamination bond strength in flexible packaging. It specifies a fixed crosshead speed of 254 mm/min (10 in/min), a standard specimen width of 25.4mm, and standard conditioning of 23°C / 50% RH for 24 hours. [1]
On paper this looks tightly controlled. In practice, three sources of variation consistently produce non-comparable results between laboratories:
Variable 1: Test speed: ASTM D1876 specifies 254 mm/min, but the flexible packaging industry does not universally follow one standard. ASTM F88 (seal strength), ISO 11339 (T-peel for flexible-to-flexible assemblies), and internal test methods are all in simultaneous use across the supply chain, each with different specified speeds ranging from 100 to 300 mm/min. [2] Even within laboratories following the same standard, actual crosshead speed is not always verified against calibration records. The speed at which the test is run directly affects the reported number.
Variable 2: Specimen width: ASTM D1876 specifies 25.4mm, but 15mm and 10mm specimens are commonly used in practice, particularly in European and Japanese laboratory protocols. [3] Results are normalized by dividing force by width, which appears to make the choice irrelevant but for flexible film laminates, this normalization is not perfectly linear.
Variable 3: Test technique: How the specimen tails are handled during the test, unsupported, hand-supported at 90°, or fixture-supported, is not uniformly specified and varies significantly between laboratories. The technique directly affects the peel geometry and therefore the measured force.
Each of these three variables independently affects the reported bond strength number. Together, their compound effect can be substantial and systematic. Understanding how each one moves the number, and in which direction, is the foundation of intelligent quality management.
Variable 1: Test Speed, The Rate Effect
The polyurethane adhesive bonding your laminate is not an elastic solid. It is a viscoelastic material, it has both elastic and viscous character, and its mechanical response depends critically on the rate at which force is applied to it.
This is established polymer physics. A theoretical treatment published in the Journal of Colloid Science confirmed that peel force for bonds comprising viscoelastic adhesive interlayers is strongly rate-dependent. From master curves of interlayer dynamic moduli, peel force master curves can be calculated and peel rate and temperature are interchangeable variables in determining peel response, connected through the Williams-Landel-Ferry (WLF) equation. [4]
For a viscoelastic adhesive like a crosslinked polyurethane dry lamination system, the rate effect follows a characteristic curve across the full range of peel speeds:
At very low peel rates, the adhesive has sufficient time to flow viscously during the peel event. It behaves liquid-like, dissipates energy efficiently, and the measured peel force is relatively low and fairly constant. [4,6]
At intermediate rates, the practical range where all common test standards operate, peel force rises with increasing speed. The adhesive has less time to relax viscoelastically. It behaves more rubber-like, stores more elastic energy, and resists separation with greater force. The relationship between peel rate and adhesion energy follows a power law, systematic, predictable, and reproducible. [4,6]
At very high rates, well above practical test speeds, peel force decreases sharply. The adhesive transitions to glass-like behavior, it fractures rather than peels, and fracture energy is lower than viscoelastic dissipation energy. [6]
This is not theoretical. IMADA Co., Ltd published experimental peel test data in 2026 measuring the same adhesive tape samples at 50 mm/min, 300 mm/min, and 600 mm/min. The result was unambiguous: adhesive strength increased as test speed increased, regardless of peel angle. [7]
The same study noted an additional effect: higher test speeds produce more variable, less stable measurements likely due to test stand vibration effects at higher crosshead velocities. When laboratories report average peel force from a high-speed test, they incorporate upward measurement noise into the average, further biasing the reported number. [7]
Direction of effect: Higher test speed --> Higher reported bond strength.
A published review on flexible laminate peel testing confirmed this: the measured peel force values are dependent on test rate, and energy dissipation through viscoelastic deformation of the peel arm affects how much of the external work was actually available for debonding the laminate. [8]
The practical consequence: a converter laboratory following ASTM D1876 at 254 mm/min and a brand owner laboratory using an internal method at 150 mm/min are not measuring the same quantity from the same laminate even if both report N/15mm. The adhesive has not changed. The measurement speed has changed.
Variable 2: Specimen Width, The Geometry Effect
ASTM D1876 specifies 25.4mm specimen width, but 15mm and 10mm are commonly used in practice, particularly in European and Japanese laboratory protocols. [3] Since bond strength is reported as force divided by width, the arithmetic normalization appears to make width irrelevant. In theory, 4.5N from a 15mm specimen and 7.5N from a 25mm specimen both normalize to 3.0 N/mm, is identical.
In practice, for flexible packaging films, this linear relationship does not hold perfectly. A study specifically investigating T-peel test optimization for flexible packaging film, using aluminum foil and CPP laminate, one of the most common structures in the industry, used specimen widths of 5mm, 10mm, and 15mm as the signal factor to measure peel strength linearity. The study was motivated precisely because standard methods produce significant variation in peel strength, and specimen width non-linearity was a contributing factor requiring its own optimization protocol. [9]
Why does the linear assumption fail for flexible film?
During a peel test, stress is not uniformly distributed across the specimen width. The peel front behaves as a propagating crack, and stress concentrates at the edges of the specimen. A narrower specimen has a higher proportion of its total width near the edges, edge-affected material represents a larger fraction of the total. A wider specimen has proportionally more bulk center material, with lower average edge stress concentration.
Simultaneously, a narrower specimen has lower bending stiffness, it deforms differently at the peel front than a wider specimen of the same film. Since bending energy dissipation at the peel front contributes to the measured peel force, different specimen widths produce different bending contributions to the total measured force. [8]
The result: for flexible film laminates, a 15mm specimen and a 25.4mm specimen do not normalize to identical N/mm values from the same laminate. The deviation from linearity is real, was specifically documented for flexible packaging structures, and requires a dedicated optimization protocol to manage. [9]
The deviation from linearity can go either way depending on the specific film structure, stiffness, and thickness combination. What it does is introduce systematic non-comparability between laboratories using different widths, even after arithmetic normalization.
A brand owner specifying "minimum 3.0 N/15mm" while the converter reports results in N/25mm and converts arithmetically is not comparing the same physical measurement even when the arithmetic appears correct.
Variable 3: Test Technique, The Largest Single Variable
This is where the largest differences between laboratories arise.
In T-peel testing, how the specimen tails are handled determines the peel geometry throughout the test and peel geometry directly determines how much of the applied force goes into debonding the interface versus bending the film.
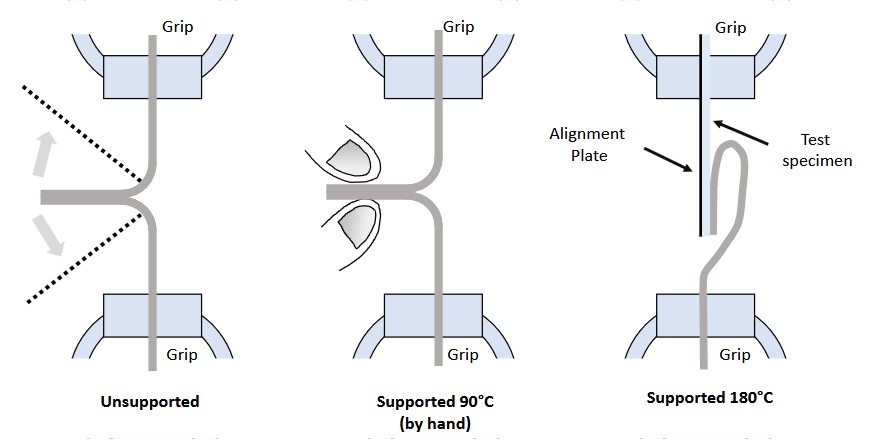
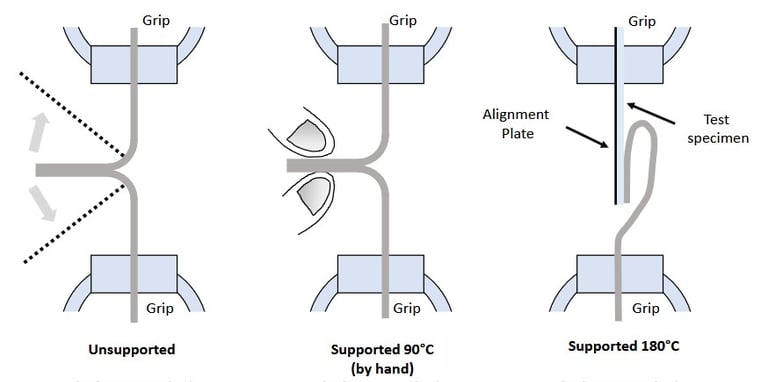
Unsupported T-peel (Technique A in ASTM F88 terminology, and the most common approach in flexible packaging laboratories): both film tails are gripped in opposing jaws and pulled apart with no external support of the specimen body. [10] The peel angle is determined by the natural geometry of the specimen, it varies as the test proceeds and depends on the relative stiffness and thickness of both film layers. For flexible films in T-peel, the natural equilibrium peel angle is typically less than 180°, meaning the applied force vector has a component that is not purely opposing the bond. Part of the force goes into bending the film, part goes into debonding the interface. [8]
Hand-supported at 90°: the unsealed portion of one specimen tail is held at 90° to the seal plane by the operator's hand during testing. The peel geometry is more controlled and more consistent between tests. The fixed geometry typically produces higher and more reproducible reported bond strength values than unsupported T-peel, because the peel angle is defined rather than variable.
Fully fixture-supported: both tails are mechanically supported throughout the test, eliminating film bending contribution and operator variability entirely. This produces the most geometry-consistent results but different absolute numbers from both other techniques.
ASTM F88 documentation states explicitly that customers who support the tail of the specimen by hand will see different results from those who test without providing any support and that even hanging load cell cables produce drag forces that adversely affect results. [10]
Direction of effect: Unsupported T-peel > Hand-supported at 90° > Supported 180°, in reported bond strength, for the same laminate.
The magnitude of this technique effect can be substantial. Researchers demonstrated that removing specimen tail support during T-peel testing of flexible laminates on vertical machines increased measured peel force by up to 85.65% compared to properly supported tests due to gravity-induced asymmetry and mixed-mode failure. [5]
A converter using hand-supported technique and a brand owner using unsupported T-peel are not conducting the same test even if both cite the same standard on their quality certificate.
The Compound Effect: When All Three Variables Work Together
Consider this realistic scenario that occurs regularly in the flexible packaging supply chain:
Converter laboratory: internal method at 300 mm/min, specimen width 25.4mm, hand-supported at 90°. Brand owner incoming inspection: ASTM D1876 at 254 mm/min, specimen width 15mm, unsupported T-peel.
Both reporting N/15mm after width conversion.
The converter's measurement benefits from: higher speed (higher viscoelastic rate effect), wider specimen (different edge stress distribution), and controlled peel geometry (hand-supported, defined angle). The brand owner's measurement uses: standard ASTM speed, narrower specimen, and unsupported variable geometry.
The result: the converter's outgoing quality certificate will consistently show higher bond strength numbers than the brand owner's incoming inspection from the same laminate roll. The gap is not random variation. It is systematic, directional, and reproducible. It will appear on every roll, every shipment, every audit.
This is the scenario that experienced quality managers recognize, the converter's numbers are always higher than ours without knowing precisely why.
The Standardization Approach
The same understanding that explains measurement discrepancies also reveals how to resolve them.
The first diagnostic question that any quality team should establish between parties: "Please provide your complete test protocol which include crosshead speed, specimen width, test technique, conditioning temperature and humidity, and tensile tester make and model."
Then test an incoming roll under those exact same conditions and compare. Discrepancies that survive this alignment point to genuine bond quality issues. Discrepancies that disappear after alignment point to protocol differences which is equally important to know, and far more common than either party realizes.
A secondary diagnostic: request the raw force-displacement curve, not just the reported average. A clean curve with consistent peel force across the specimen length is genuine. A curve with high initial peak force followed by a declining plateau, characteristic of a laminate peeling at a speed where viscoelastic stiffening inflates the early measurement, tells a different story.
What a Properly Written Bond Strength Specification Looks Like
A specification that reads "minimum bond strength 3.0 N/15mm per ASTM D1876" has three hidden degrees of freedom in practice. It is not a complete specification, it is an invitation for systematic discrepancy.
A specification with proper quality assurance reads:
"Minimum bond strength 3.0 N/15mm, tested per ASTM D1876, crosshead speed 254 mm/min, specimen width 15mm, unsupported T-peel geometry, conditioned 24 hours at 23°C / 50% RH prior to testing. Raw force-displacement curve to be provided with each certificate."
Every parameter fixed. Both converter and brand owner laboratories test under identical conditions. The number is now comparable and the raw curve requirement eliminates the possibility of reporting only peak values from favorable test segments.
This level of specification detail is standard practice in pharmaceutical packaging and medical device packaging. It is far less common in food and consumer goods flexible packaging which is precisely where the measurement ambiguity most frequently generates quality disputes.
The Broader Picture
Bond strength, as reported in flexible packaging quality documentation, is not a material property. It is a system output. As a published PMC review on flexible laminate peel testing states: an experimental determination of the peel force in N per unit width is not sufficient for describing the characteristics of adhesion within a flexible polymeric laminate because the measured peel force values are dependent on test geometry, peel angle, test rate, and temperature. [8]
The industry has largely treated the number as absolute because it correlates well enough with laminate performance for practical purposes within a single laboratory with consistent protocols. It breaks down precisely when it matters most when two parties with different laboratories, different protocols, and different equipment are trying to resolve a dispute using a number that was never designed to be absolute.
Understanding what you are actually measuring is the first step to measuring it correctly and to recognizing when someone else is measuring it differently.
Sources:
[1] ASTM D1876, Standard Test Method for Peel Resistance of Adhesives (T-Peel Test). ASTM International. https://www.instron.com/en/testing-solutions/astm-standards/astm-d1876/
[2] Mecmesin. T-Peel Testing ASTM D1876 and ISO 11339. Mecmesin.com https://www.mecmesin.com/test-type/t-peel
[3] ScienceDirect Topics. T-Peel Test — Specimen Width in Practice. https://www.sciencedirect.com/topics/engineering/t-peel-test
[4] Kaelble, D.H. (1964). Theory and Analysis of Peel Adhesion: Rate-Temperature Dependence of Viscoelastic Interlayers. Journal of Colloid Science, 19, 413–424. https://www.sciencedirect.com/science/article/abs/pii/0095852264900418
[5] Enhancing the Performance of the T-Peel Test for Thin and Flexible Adhered Laminates (2015). arXiv:1511.06472. https://arxiv.org/abs/1511.06472
[6] Gent, A.N. & Petrich, R.P. (1969). Adhesion of Viscoelastic Materials to Rigid Substrates. Proceedings of the Royal Society of London A, 310(1502), 433–448. DOI: 10.1098/rspa.1969.0085. https://royalsocietypublishing.org/doi/10.1098/rspa.1969.0085
[7] IMADA Co., Ltd. Adhesive Tape Peel Test — Investigation of the Effects of Test Speed, Peel Angle, and Temperature on Peel Force. Force-Channel.com (2026). https://force-channel.com/en/post_2696/
[8] Peeling of Flexible Laminates — Determination of Interlayer Adhesion of Backsheet Laminates Used for Photovoltaic Modules. PMC / MDPI Materials (2022). https://pmc.ncbi.nlm.nih.gov/articles/PMC9103033/
[9] L18 Optimization of T-Peel Test Method for Flexible Packaging Film (2012). ResearchGate. https://www.researchgate.net/publication/258840257_L18_Optimization_of_T-Peel_Test_Method_for_Flexible_Packaging_Film
[10] Instron. ASTM F88 Seal Strength of Flexible Barrier Materials. https://www.instron.com/en/testing-solutions/astm-standards/astm-f88/
Have a specific challenge in your production process?
All technical consultations and inquiries are treated as strictly confidential. Production details, formulation data, and business information you share are used only to serve your specific needs — never disclosed to third parties or supply chain partners without your consent. Reach out to Arif Sarwono at contact@mdm-technology.com
Reach out anytime for chemical engineering or chemical application tips or discussion
Contact US
contact@mdm-technology.com
taramkt@gmail.com
+62811883915
+62818159065
© 2026. MDM Technology All rights reserved.